Every destination marketing organization I talk to has some version of the same question: we know LGBTQ+ travelers matter — so what actually works?
It’s a fair question, and most of the answers out there are either a strategy deck or a national campaign with a budget few DMOs will ever see. So here’s something more useful: one real month of one real destination’s LGBTQ+ advertising, with the results broken down by ad.
The destination is Palm Springs. But as you read it, swap in your own. Your resorts, your neighborhoods, your Pride weekend, your signature event. Almost nothing that worked here depends on being in the desert.
The Destination
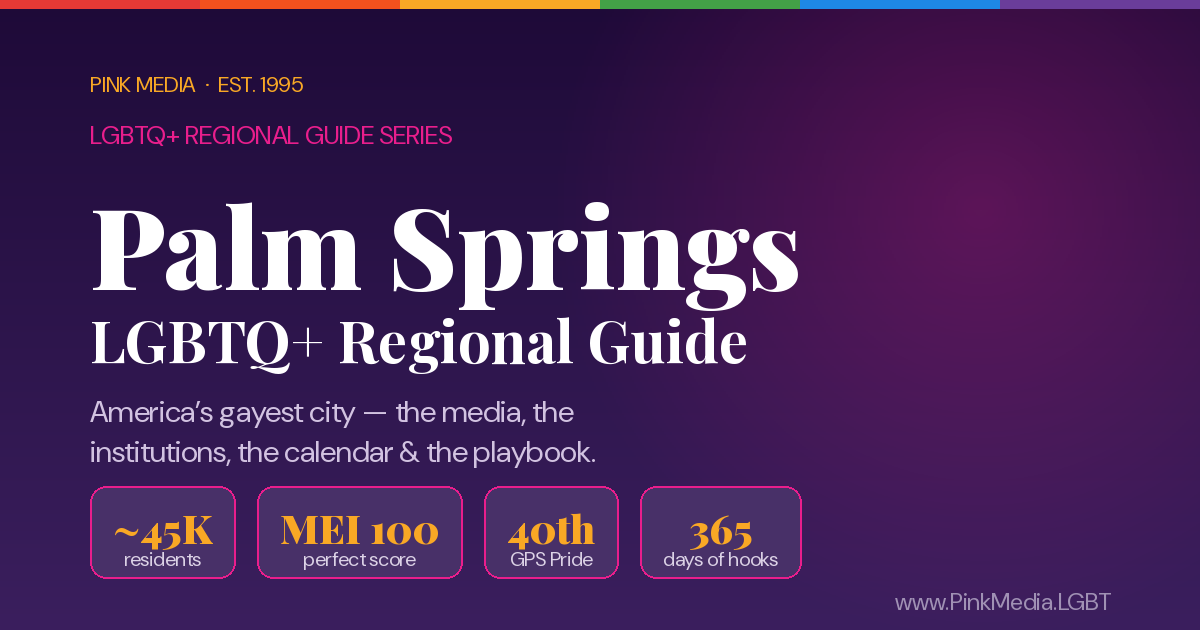
Palm Springs is about as clear-cut an LGBTQ+ destination as exists in America. It seated the country’s first all-LGBTQ+ city council in 2017, scores a perfect 100 on HRC’s Municipal Equality Index, and is home to a local LGBTQ+ media scene we mapped in our LGBTQ+ Palm Springs Regional Guide. In September, Visit Greater Palm Springs became the first California organization to reach Gold-level partnership with IGLTA, the International LGBTQ+ Travel Association.
And this November, Greater Palm Springs Pride celebrates its 40th year, November 6–8, under the theme “Be Included.” Organizers say Pride Week draws more than 200,000 people.
Which is exactly why this is a useful case study. You might assume a destination like Palm Springs doesn’t need to work at reaching LGBTQ+ travelers. It does — every month. Reputation gets you considered. Advertising gets you booked.
The Campaign
Our work for Visit Palm Springs runs on Facebook and Instagram, reaching LGBTQ+ travelers through a rotating set of creatives that point to Visit Palm Springs content. In October, eight ads were in rotation:
- Gay Resorts Guide — a short video on LGBTQ+ resorts in Palm Springs
- Pride 2026, plus a new Pride video and a new Pride image — all promoting the 40th anniversary weekend
- 3 Day LGBTQ Getaway — a ready-made itinerary
- Arenas District Guide — the city’s LGBTQ+ neighborhood
- Modernism Week and Halloween — seasonal and event content
The big change from September was video. New video creatives went into rotation for both the Gay Resorts Guide and Pride.
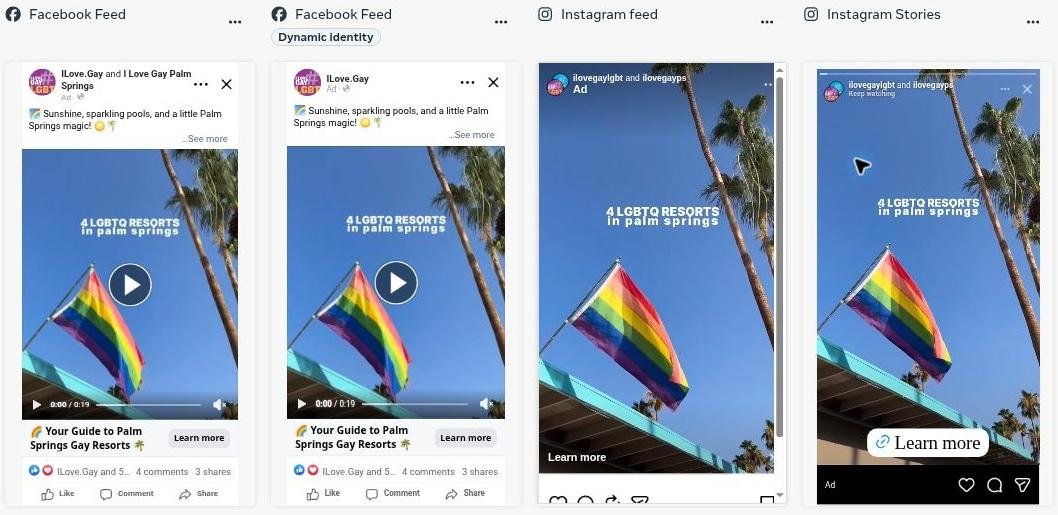
The Gay Resorts Guide video — October’s top performer — across Facebook and Instagram placements.
October vs. September
| Metric | September | October | Change |
|---|---|---|---|
| Impressions | 58,454 | 68,306 | +16.9% |
| Reach | 37,959 | 44,436 | +17.1% |
| Post engagements | 5,334 | 9,398 | +76.2% |
| Link clicks | 2,985 | 4,402 | +47.5% |
| Landing page views | 2,705 | 3,953 | +46.1% |
| Landing page view rate | 4.63% | 5.79% | +25.1% |
| Link click-through rate | 5.11% | 6.44% | +1.3 pts |
| Cost per link click | ~$0.48 | ~$0.37 | −24.5% |
| Cost per landing page view | $0.54 | $0.41 | −23.9% |
Impressions rose about 17%. Landing page views rose 46%. Engagement rose 76%. When results grow that much faster than delivery, it isn’t the budget doing the work — it’s the creative.
Ad by Ad
Here’s October broken down by creative. The landing page view rate in this report is landing page views divided by impressions — the share of everyone who saw the ad who ended up on Visit Palm Springs content.
| Ad | Impr. | Clicks | LPVs | LPV rate | Per click | Per LPV |
|---|---|---|---|---|---|---|
| Gay Resorts Guide | 13,108 | 2,163 | 1,910 | 14.57% | $0.21 | $0.24 |
| Pride 2026 | 45,640 | 1,590 | 1,472 | 3.23% | $0.52 | $0.57 |
| Pride 2026 New Video | 3,693 | 390 | 353 | 9.56% | $0.43 | $0.48 |
| 3 Day LGBTQ Getaway | 2,096 | 120 | 96 | 4.58% | $0.51 | $0.63 |
| Pride 2026 New Image | 2,531 | 88 | 77 | 3.04% | $0.64 | $0.73 |
| Arenas District Guide | 526 | 23 | 23 | 4.37% | $0.52 | $0.52 |
| Modernism Week | 617 | 23 | 18 | 2.92% | $0.51 | $0.65 |
| Halloween | 95 | 5 | 4 | 4.21% | $0.49 | $0.62 |
| Total | 68,306 | 4,402 | 3,953 | 5.79% | ~$0.37 | $0.41 |
Two ads did almost all of the work. The Gay Resorts Guide produced 1,910 landing page views — 48% of the campaign — and the three Pride creatives together produced 1,902, another 48%. Everything else combined accounted for the remaining 4%.
Here’s what that adds up to, as five strategies you could run for your own destination next month.
Strategy 1: Lead With Something Useful
The single best ad in the campaign wasn’t about an event, a skyline or a slogan. It was a guide to LGBTQ+ resorts. Nineteen seconds of video, a rainbow flag over a pool deck, and a promise: here’s where to stay.
It delivered a 14.57% landing page view rate — two and a half times the campaign average — at $0.24 per visit and about 21 cents a click. Its link click-through rate was 16.5%. And it generated 5,081 post engagements, more than half of the month’s total.
This isn’t a one-month fluke. In September, the top performer was also a guide — a Summer Fun Guide that drove 2,284 landing page views. LGBTQ+ travelers are planners. They want to know where they’ll be welcome, where to stay and what to do. Content that answers those questions gets clicked, because it’s the content they were going to search for anyway.
Your destination’s best LGBTQ+ ad may not be an ad at all. It may be the guide you already have — or the one you should write next — with thirty seconds of video in front of it.
Strategy 2: Make Video the Default
October gave us an unusually clear look at video versus a still image, because both were promoting the same event in the same month.
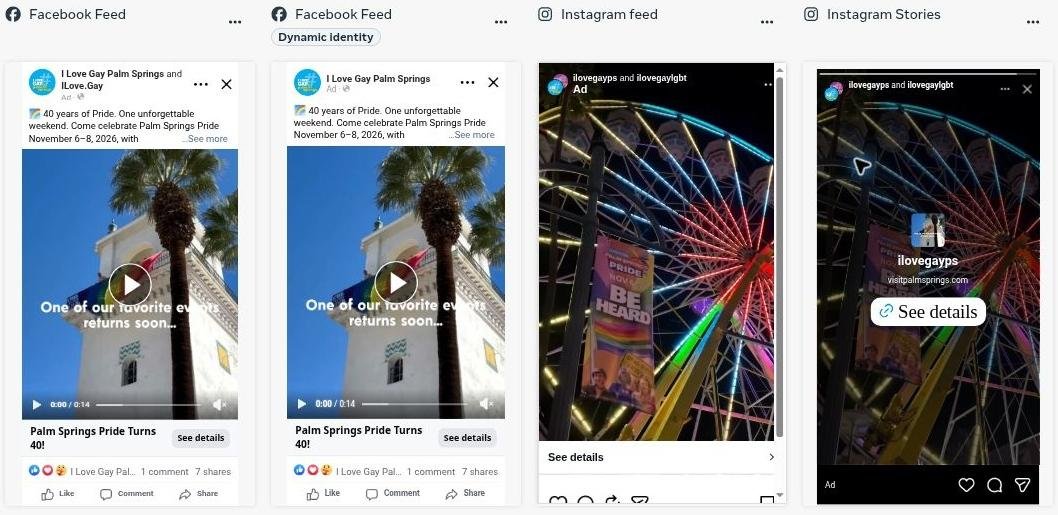
The new Pride 2026 video: “Palm Springs Pride Turns 40!”
Pride 2026 New Image
- 3.04% landing page view rate
- $0.73 per landing page view
- About $0.64 per link click
- About 6% of viewers engaged
Pride 2026 New Video
- 9.56% landing page view rate
- $0.48 per landing page view
- About $0.43 per link click
- About 50% of viewers engaged
The video turned viewers into visitors at more than three times the rate of the image, at about a third less per visit. Engagement wasn’t close. And between them, the Gay Resorts Guide video and the Pride video produced nearly three-quarters of all October engagement.
One honest caveat: the two ads didn’t get identical delivery, so this isn’t a controlled test. But when the same pattern shows up on two different videos in the same month, it’s a signal worth acting on. Video doesn’t need to be elaborate, either. Short, simple clips of real places — a flag over a pool, a Ferris wheel lit up for Pride — did the job here.
Strategy 3: Wrap Your Anchor Event
Pride’s 40th anniversary is the biggest LGBTQ+ moment on the Palm Springs calendar, and the campaign treated it that way. Not one Pride ad, but three — each with a different job.
The reach ad
Pride 2026 carried the visibility: 45,640 impressions, two-thirds of the month’s delivery, and 1,472 landing page views. Its conversion rate was lower, which is normal for the ad doing the broadest work.
The conversion ad
The new Pride video was smaller and sharper: 353 visits at a 9.56% landing page view rate. It’s the one to lean on as the event gets closer.
The test
The new Pride image ran alongside it, and lost. That’s useful too. Now you know where the remaining event budget should go.
Together, those three ads produced 1,902 landing page views. Whatever your destination’s anchor event is — Pride, a festival, a circuit party, a film festival — it deserves the same treatment: start early, run more than one creative, and move the budget to whatever is converting.
Strategy 4: Speak Through Trusted Voices
Look closely at the ads and you’ll notice they don’t run from a tourism board’s brand page alone. They appear through community-run LGBTQ+ pages, including I Love Gay Palm Springs, alongside Visit Palm Springs’ own content.
That matters more than it used to. Since Meta removed sensitive-interest targeting in 2022, you can’t simply select an LGBTQ+ audience — something we’ve written about in The Targeting Is Gone. The Audience Isn’t. What you can do is show up through voices that LGBTQ+ travelers already follow and trust. The same principle is behind the local radio and digital pairing in our Purple Room case study, also in Palm Springs.
Strategy 5: Measure Visits, Then Plan the Calendar
Every number in this post that matters is a landing page view: someone who saw the ad, clicked it and waited for the destination’s page to load. Impressions tell you how loud you were. Landing page views tell you how many people started planning a trip.
Reading the report that way makes next month’s decisions straightforward. For November, the Gay Resorts Guide stays in rotation. Pride gets eight days of support with the strongest creatives, before a planned pause. The 3-day getaway and the Arenas District guide get featured. And the smallest spots — Halloween ran just 95 impressions — are treated as what they are: too small to draw conclusions from.
What Many Destinations Run
- One rainbow-branded ad in June
- Still images of the skyline
- General “everyone is welcome” messaging
- The tourism board’s own page only
- Success measured in impressions
What Worked Here
- A monthly, year-round rotation
- Short vertical video of real places
- Specific guides: resorts, neighborhoods, itineraries
- Community-run LGBTQ+ pages alongside the brand
- Success measured in landing page views and cost per visit
LGBTQ+ travelers don’t need to be told they’re welcome. They need to be shown where to stay, what to do and when to come. The destinations that answer those questions — in video, every month, through voices the community trusts — are the ones that get booked.
— Matt Skallerud, President, Pink Media
Your Destination, Swapped In
If you run marketing for a destination, here’s the same playbook with Palm Springs taken out:
Your evergreen guide
Which LGBTQ+-owned or LGBTQ+-welcoming places to stay, which neighborhood to base yourself in, a ready-made three-day itinerary. If it doesn’t exist yet, it’s the first thing to build.
Your anchor event
Pride, a festival, a signature weekend. Promote it for weeks, not days, with more than one creative.
Your video
Fifteen to twenty seconds, vertical, real places, real light. Phone footage is fine. Stills should be the exception.
Your local voices
The LGBTQ+ pages, publications and creators your future visitors already follow. Show up there, not only on your own channel.
Your monthly read
Landing page views, landing page view rate and cost per visit, by ad, every month. Keep what earns its place; replace what doesn’t.
Read the numbers honestly. Figures are from Meta Ads Manager for Visit Palm Springs’ Facebook and Instagram campaign, October 2026, compared with September 2026 as previously reported. Landing page view rate is landing page views divided by impressions. Cost per click and cost per landing page view are rounded; total spend isn’t disclosed here. Reach is the sum of ad-level figures and may count the same person more than once. The two months ran different ad mixes, so month-over-month changes are not a controlled creative test, and ads with very small delivery offer limited evidence. One destination, one month — a useful shape, not a guarantee.
The Takeaway
October’s rebound didn’t come from spending more. Impressions grew 17%; landing page views grew 46%, and each one cost 24% less. The difference was content LGBTQ+ travelers actually wanted — a resort guide and a Pride anniversary — told in video, through voices they trust, and measured by whether people showed up on the destination’s pages.
Palm Springs has a head start most destinations don’t. But none of these five strategies needs one. A guide, an event, a phone camera, the right local partners and an honest monthly report. That’s a campaign almost any destination could be running by next month.
Our 2026 LGBTQ+ Travel Market Guide covers the national picture behind campaigns like this one, and Every DMO Now Has an LGBTQ+ Travel Strategy. Almost None Have an LGBTQ+ Travel Audience. looks at why so many destination plans stall between the strategy deck and the feed.
 Read the LGBTQ+ Palm Springs Regional Guide →
- Palm Springs Pride Announces 2026 Theme: “Be Included” — Greater Palm Springs Pride. The 40th annual celebration, November 6–8, 2026, and organizers’ estimate of 200,000+ attendees for Pride Week.
- Visit Greater Palm Springs Strengthens Partnership with IGLTA — Travel Weekly. The region’s Gold-level IGLTA partnership, a first for a California organization.
- LGBTQ+ Palm Springs Regional Guide — Pink Media. The city’s civic history, HRC equality scores, local LGBTQ+ media and 2026 event calendar.
- Vikings, Cowgays and a 40th Birthday Parade: Your Palm Springs Pride 2026 Story — ILoveGay.NET. A planning overview of Pride’s 40th.
- Sell November, Not Just Tonight. — Pink Media. A companion Palm Springs case study on local radio plus social for live entertainment.
- The Targeting Is Gone. The Audience Isn’t. — Pink Media. Why Meta’s 2022 targeting change reshaped how campaigns reach LGBTQ+ audiences.
- Every DMO Now Has an LGBTQ+ Travel Strategy. Almost None Have an LGBTQ+ Travel Audience. — Pink Media.
- 2026 LGBTQ+ Travel Market Guide — Pink Media.
- Campaign data: Visit Palm Springs Campaign Summary Report, October 2026 (Meta Ads Manager, Facebook and Instagram), with September 2026 comparison. Total spend withheld at the client’s request.