
Last week I was doing one of the least glamorous jobs in advertising: taking cards off a carousel ad because the shows on them had already happened.
It’s a small task. You open the ad, remove the expired card, check that the rest still line up, and save. But somewhere around the second card I realized what we were actually doing. We had built a campaign that was designed to get smaller every few days. By the end of October it would have been one lonely card for one last show — with all the momentum the ad had built up spent on a calendar that was about to run out.
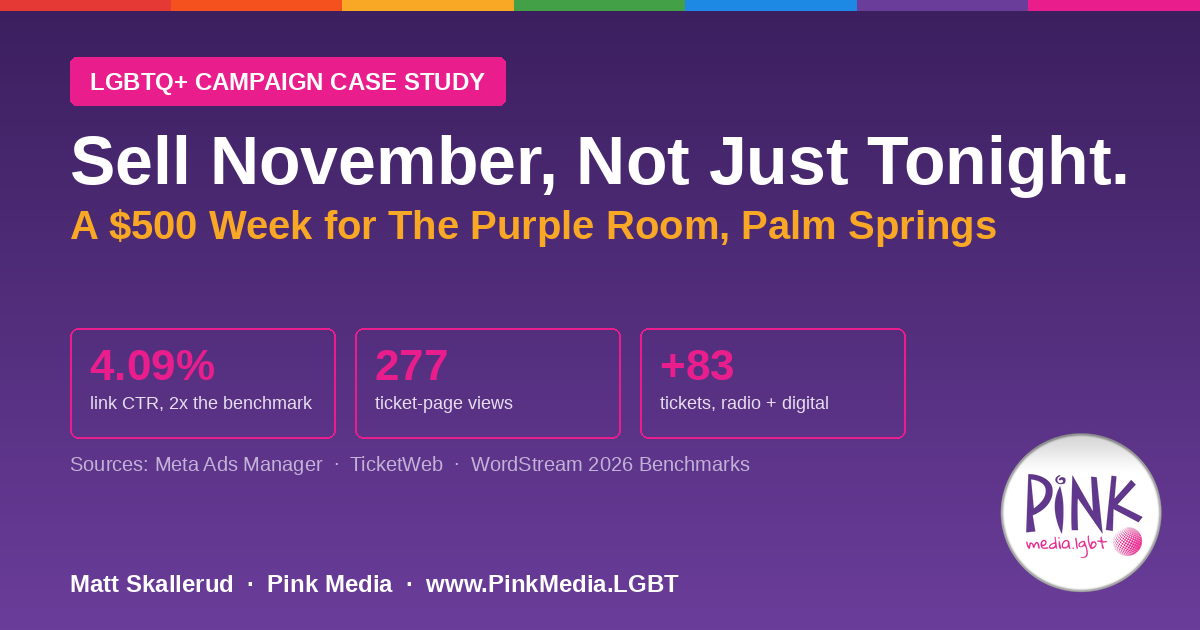
So we changed it. Instead of letting the carousel shrink, we refreshed it to start selling November. Here’s the campaign that led us there, with the numbers left in.
The Setup
The Purple Room is one of Palm Springs’ best-known supper clubs — cabaret, comedy, drag, tribute acts and live music, most nights of the week, in a city that our Palm Springs regional guide describes as one of the most concentrated LGBTQ+ markets in the country. The goal was simple: sell tickets to eight October performances across six shows.
We ran it as a combined effort. On air, KGAY, Palm Springs’ LGBTQ+ radio station, carried the shows to its listeners. Online, we built a single Facebook and Instagram carousel ad running from the I Love Gay Palm Springs page, with one card per show — its own image, headline, date and “Book now” button — plus a card pointing to the page listing every Purple Room show.
Budget: $500 for one week. Launch date: October 13.
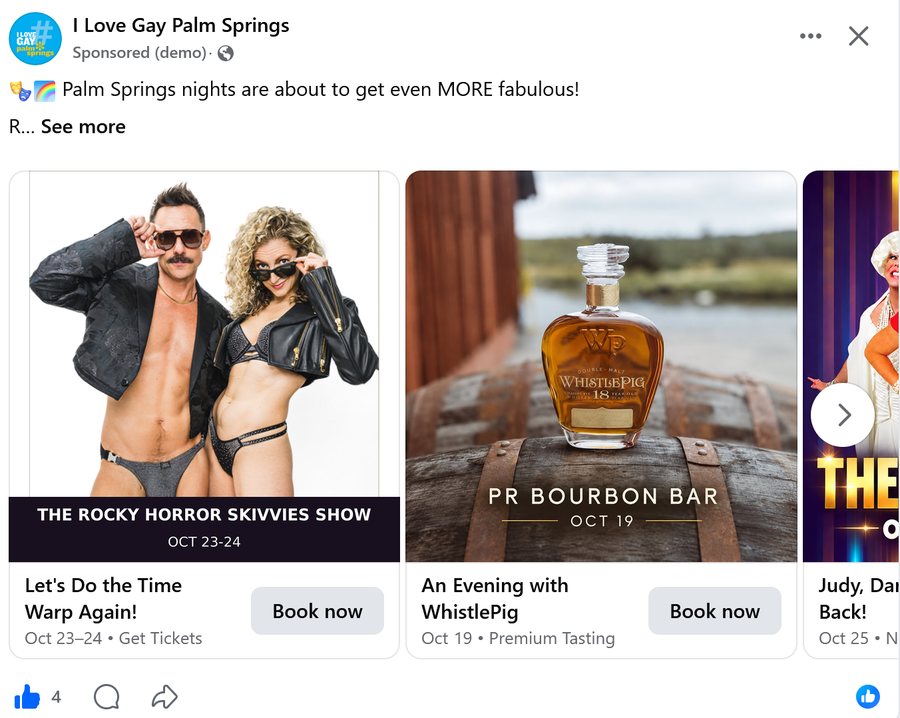
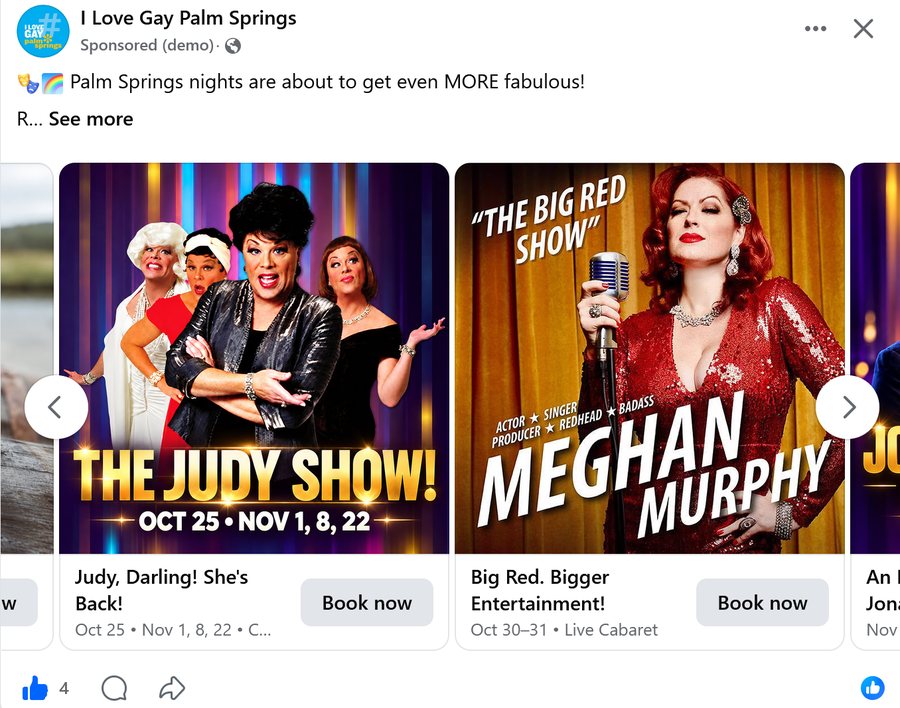
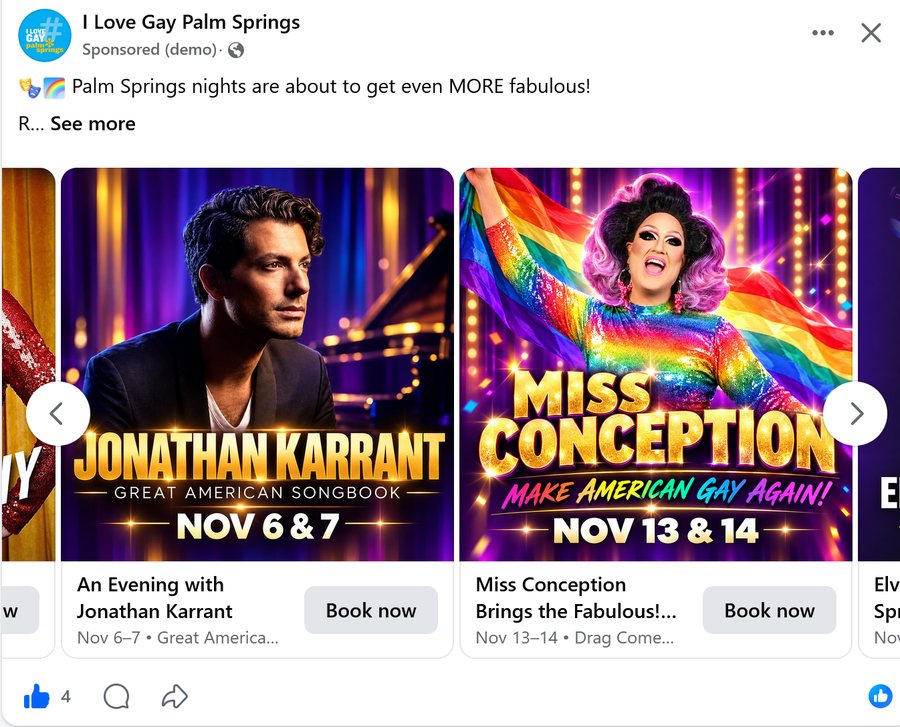
The refreshed carousel: October shows up front, November dates added behind them.
What Came Back
Here’s what Meta delivered from launch through the latest report:
| Metric | Result | What it tells you |
|---|---|---|
| Impressions | 7,722 | Total ad views across Facebook and Instagram |
| Reach | 5,049 people | Unique accounts — a frequency of about 1.5 in one week |
| Link clicks | 316 | People who left the feed for a show or ticket page |
| Link click-through rate | 4.09% | Roughly twice the 1.93% traffic-campaign benchmark |
| Landing page views | 277 | Clicks that fully loaded the ticket page — 88% follow-through |
| Cost per link click | ~$1.58 | Calculated against the full $500 budget |
| Cost per ticket-page view | ~$1.81 | What it cost to put a buyer on the purchase page |
| Effective CPM | ~$64.75 | High by design — one small market, one compressed week |
For context, WordStream’s 2026 Facebook Ads benchmarks put the average click-through rate for traffic campaigns at 1.93% across all industries. This carousel ran 4.09%.
The number I’d point to first, though, is the 88%. Of 316 people who clicked, 277 stayed long enough for the ticket page to load. When we ran our last small-budget case study, two-thirds follow-through was a healthy result. This one is higher, and it makes sense: each card promised one specific show on one specific night, and the click took you straight to that show’s tickets. No guessing, no hunting.
The CPM here is nearly three times what a broader audience would cost. That’s fine. In a market the size of the Coachella Valley, you pay more to reach fewer people — and you’re paying to reach the people who can actually be in the room on Thursday night.
Where the Clicks Went
A carousel tells you something a single ad can’t: which show people actually wanted to look at.
| Destination | Link clicks | Share of clicks |
|---|---|---|
| Rocky Horror Skivvies | 174 | 55% |
| Elvis: The Early Years | 48 | 15% |
| WhistlePig | 14 | 4% |
| Meghan Murphy | 13 | 4% |
| The Judy Show | 11 | 3% |
| Black Market Trust | 8 | 3% |
| All Purple Room shows page | 48 | 15% |
Rocky Horror took more than half of everything. That’s not a surprise if you look at the card — it’s the boldest, cheekiest image in the set, and it stops a thumb mid-scroll. The other number worth noticing is the 48 clicks to the all-shows page. Those are people who liked the idea of a night at The Purple Room before they’d picked a show. A “see everything” card earns its place in a venue carousel.
What the Box Office Did
Clicks are the platform’s story. Tickets are the client’s. We compared TicketWeb figures from October 12, the day before launch, with the latest available sales snapshots:
| Show | Additional tickets sold | Total sold |
|---|---|---|
| Rocky Horror Skivvies (2 shows) | +26 | 131 |
| Elvis: The Early Years | +21 | 74 |
| Black Market Trust | +13 | 95 |
| Meghan Murphy (2 shows) | +12 | 155 |
| The Judy Show | +6 | 83 |
| WhistlePig | +5 | 32 |
| Total | +83 | 570 |
I want to be careful with this table, because it’s the kind that gets misread. These figures show ticket-sales growth during our combined KGAY radio and digital promotion. They are not sales attributed to the carousel alone, or to the radio alone. You’ll notice I haven’t divided $500 by 83 tickets anywhere in this post. That number would look tidy, and it wouldn’t be true.
Clicks and Tickets Don’t Rank the Same Way
Put the two tables next to each other and the most useful thing in this case study shows up.
Rocky Horror led both lists — 174 clicks, 26 more tickets. Elvis held second on both — 48 clicks, 21 more tickets. So far, so tidy. Then it gets interesting. Black Market Trust drew just 8 clicks but added 13 tickets. Meghan Murphy drew 13 clicks and added 12. Meanwhile WhistlePig drew 14 clicks and added 5.
That’s exactly what you’d expect from a radio-plus-digital campaign. A bold image earns clicks from people who are curious. An established act with a loyal following — especially one a listener just heard about on the radio during the drive home — often sells without anyone clicking anything. They go straight to the box office.
If we’d only looked at the Meta report, we’d have concluded Black Market Trust wasn’t working. If we’d only looked at TicketWeb, we’d have no idea Rocky Horror’s creative was doing most of the heavy lifting on social. You need both.
Why We Stopped Letting the Cards Disappear
Which brings me back to that afternoon of removing cards.
We’d set the campaign up the way most event campaigns are set up: one month, one set of shows, end date matching the last performance. It’s logical, and it has a built-in flaw. Every time a show passes, the ad loses a card, the audience has less to choose from, and the campaign gets weaker exactly as it’s gaining momentum.
So the carousel now rolls forward. As October shows pass, their cards come out and November’s go in: Jonathan Karrant and the Great American Songbook on November 6 and 7, Miss Conception on November 13 and 14, the return of Elvis with Scot Bruce, and additional November dates for The Judy Show. WhistlePig’s card retires now that its night has come and gone.
The Expiring Carousel
- Built for one month, ends with the last show
- Loses a card every time a date passes
- Fewer choices for the audience each week
- Next month starts from zero with a new ad
- Sells tonight, but never sells ahead
The Rolling Carousel
- Runs continuously as long as the calendar does
- Replaces past dates with what’s coming next
- Always offers a full set of shows to choose from
- Keeps the ad’s history and learning intact
- Starts selling next month while this month plays
A venue’s calendar doesn’t end on the 31st, so its advertising shouldn’t either. The best time to sell a November show is while people are still talking about the October one.
— Matt Skallerud, President, Pink Media
What Made It Work
1. One card, one show, one date
Every card made a single, specific promise and linked straight to that show’s tickets. That’s where the 88% follow-through comes from.
2. A local voice alongside the ads
KGAY gave the shows credibility and reach with listeners who might never click an ad. Social put the booking button in front of them. Each channel covered what the other couldn’t.
3. A tight geographic footprint
Palm Springs and the surrounding valley — the people who can actually be in a seat on show night. The CPM is higher for it, and the clicks are worth more.
4. A “see everything” card
Forty-eight people went to the full lineup instead of one show. For a venue, that’s an audience shopping for a night out, and it deserves its own door.
5. A sales baseline before launch
Pulling TicketWeb numbers on October 12 is what lets us talk about box office movement at all. No baseline, no story.
Read the numbers honestly. Meta figures are from campaign launch on October 13 through the latest available report. Cost per click, cost per page view and CPM are calculated against the full $500 one-week budget. Ticket figures compare TicketWeb sales on October 12 with the latest available snapshots; some completed shows were last checked October 17. Ticket growth reflects the combined KGAY radio and digital promotion and is not attributed to either channel alone. This is one venue, one market and one week — a useful shape, not a guarantee.
The Takeaway
A one-week, $500 carousel put 277 people on Purple Room ticket pages at better than twice the platform’s average click-through rate, while the box office added 83 seats across eight October performances during the combined radio and digital push.
But the lasting lesson came from the most boring part of the job. If you’re a venue, a theater, a club or anyone else with a calendar, don’t build advertising that runs out when the month does. Let the past dates go, add the next ones, and keep the ad selling ahead of the stage.
For more on the market behind this campaign, our Palm Springs regional guide post maps the local LGBTQ+ media landscape, and the 2026 LGBTQ+ Marketplace Guide covers the national picture.
- Facebook Ads Benchmarks 2026 — WordStream. The 1.93% all-industry average click-through rate for traffic campaigns used as the comparison in this post.
- KGAY-FM — Wikipedia. Background on Palm Springs’ LGBTQ+ radio station.
- $500 In. 1,369 Clicks Out. — Pink Media. Our earlier small-budget case study, for comparison on click-through and page follow-through.
- America’s Gayest City, Mapped for Marketers — Pink Media. Inside our LGBTQ+ Palm Springs regional guide.
- 2026 LGBTQ+ Marketplace Guide — Pink Media. The national market landscape, audience segments and media categories.
- Campaign data: Meta Ads Manager, Facebook and Instagram carousel, launched October 13, 2026. Ticket data: TicketWeb sales snapshots, October 12 baseline compared with latest available figures.